
Conversation Insights
Designed an internal analytics tool that enabled contact center teams to move from signal detection to root-cause investigation without relying on manual reports.

Role
I led end-to-end design of the Conversation Insights dashboard, shaping investigation workflows, dashboard interactions, filtering architecture, and high-fidelity prototypes.
Client
Air Canada
Collaborators
1 Product owner, 4 Engineers, 1 Data Scientist, Designer (me)
Impact
100% adoption by client contact center operations teams, enabling independent investigation of customer issues and reinforcing client trust during a critical contract renewal phase.
About RozieAI
RozieAI is a customer experience (CX) solutions provider that designs and delivers AI-powered software solutions for clients in the airline and insurance industries.

Business Context:
A tool built for contact center teams at Air Canada during a period of rapid growth.
Imagine running a contact center where hundreds of thousands of customers call every day to resolve booking issues, clarify policies, and seek support during disruptions.
Hidden within these conversations are critical operational signals: recurring customer pain points, emerging service issues, routing inefficiencies, and unresolved experiences. But without a scalable way to interpret this data, teams struggle to understand what customers are calling about and respond proactively.
Conversation Insights was built to solve this problem. Designed as an internal analytics tool for Air Canada’s contact center operations teams, the platform helps managers and analysts monitor customer conversation trends, identify emerging issues, and investigate the underlying calls driving those patterns.
The product was developed ahead of a critical contract renewal, where the existing workflow for delivering insights through manual reports and slide decks was no longer scalable.
System Problem:
Clients relied on manually prepared reports and couldn’t investigate issues on their own.
Before the platform existed, customer conversation insights were delivered through a fully manual workflow. RozieAI product owners acted as intermediaries, analyzing conversation data and packaging findings into Excel reports and slide decks for client teams.
While this enabled insight delivery, it introduced a deeper structural limitation: access to interpretation. Interpretation meant understanding what was driving a spike, which calls explained it, and where it was occurring operationally.
Client teams could consume pre-packaged insights, but when they needed to understand the drivers behind a trend or trace issues back to specific calls, they had to request follow-up analysis. This created delays in operational decision-making and limited their ability to respond to emerging customer issues as they unfolded.
At its core, the opportunity was making the insights more accessible and explorable at scale.
Understanding the System:
Users, data, and how insights were structured in the manual workflow
Solving this problem required understanding how insights moved through the system: who consumed them, how they were interpreted, and how customer teams made operational decisions around them.
To uncover these dynamics, I worked closely with RozieAI product owners and data scientists to understand how insights were generated, interpreted, and operationalized in practice.
Who does the system serve?
The system supported two distinct but connected roles.
↪ Contact centre managers who focused on identifying what changed and where attention is needed
↪ Ops analysts who focused on investigating patterns and tracing them back to specific calls.
Primary Topic
Customer Intent
Root Cause
Sentiment at Start
Routing Profile
Queue ID
Agent Username
Call Channel
What data is being shared?
Conversation data was transformed into two layers of information.
↪ First, AI-derived signals such as primary topics, root causes, and sentiment helped summarize what customers were experiencing.
↪ Second, operational metadata from the call system, including routing profiles, queues, and agent-level attributes, provided context on how those conversations were handled.
These two layers were used together during the investigation. Signals helped identify patterns, while metadata helped trace where those patterns existed.
How Teams Investigated Customer Issues
Understanding the decision-making workflow that transcends from signal detection to operations diagnosis
Well, understanding data and insight metrics alone wasn’t enough. It didn’t explain how users actually made decisions and what decisions they made.
Through interviews with 6 users, I found that these metrics were not consumed in isolation. Instead, they acted as entry points into a diagnostic process, helping teams move from identifying patterns to understanding their underlying causes, and tracing where those issues exist operationally.
Decision Making Workflow
01
Scope
Define a time window to frame the analysis.
02
Identify unusual patterns
Quickly detect shifts in key metrics such as spikes in primary topics to surface emerging issues.
03
Explain causes
Use summaries and root cause signals to understand what customers are experiencing.
04
Trace issue
Drill into call-level records and operational attributes to identify where the issue is occurring and who is involved.
This revealed that insights were not endpoints, but starting points for investigation.
This investigation workflow enabled teams to take targeted operational actions such as identifying coaching opportunities for agents and refining IVR routing based on emerging customer issues.
How might we enable contact center teams to move from identifying signals to explaining what’s driving it and investigating the underlying calls without relying on intermediaries?
Solution:
Supporting both signal detection and root-cause investigation within a dashboard interface
To support the investigation workflow, I designed the dashboard around two complementary modes: Overview and Table View.
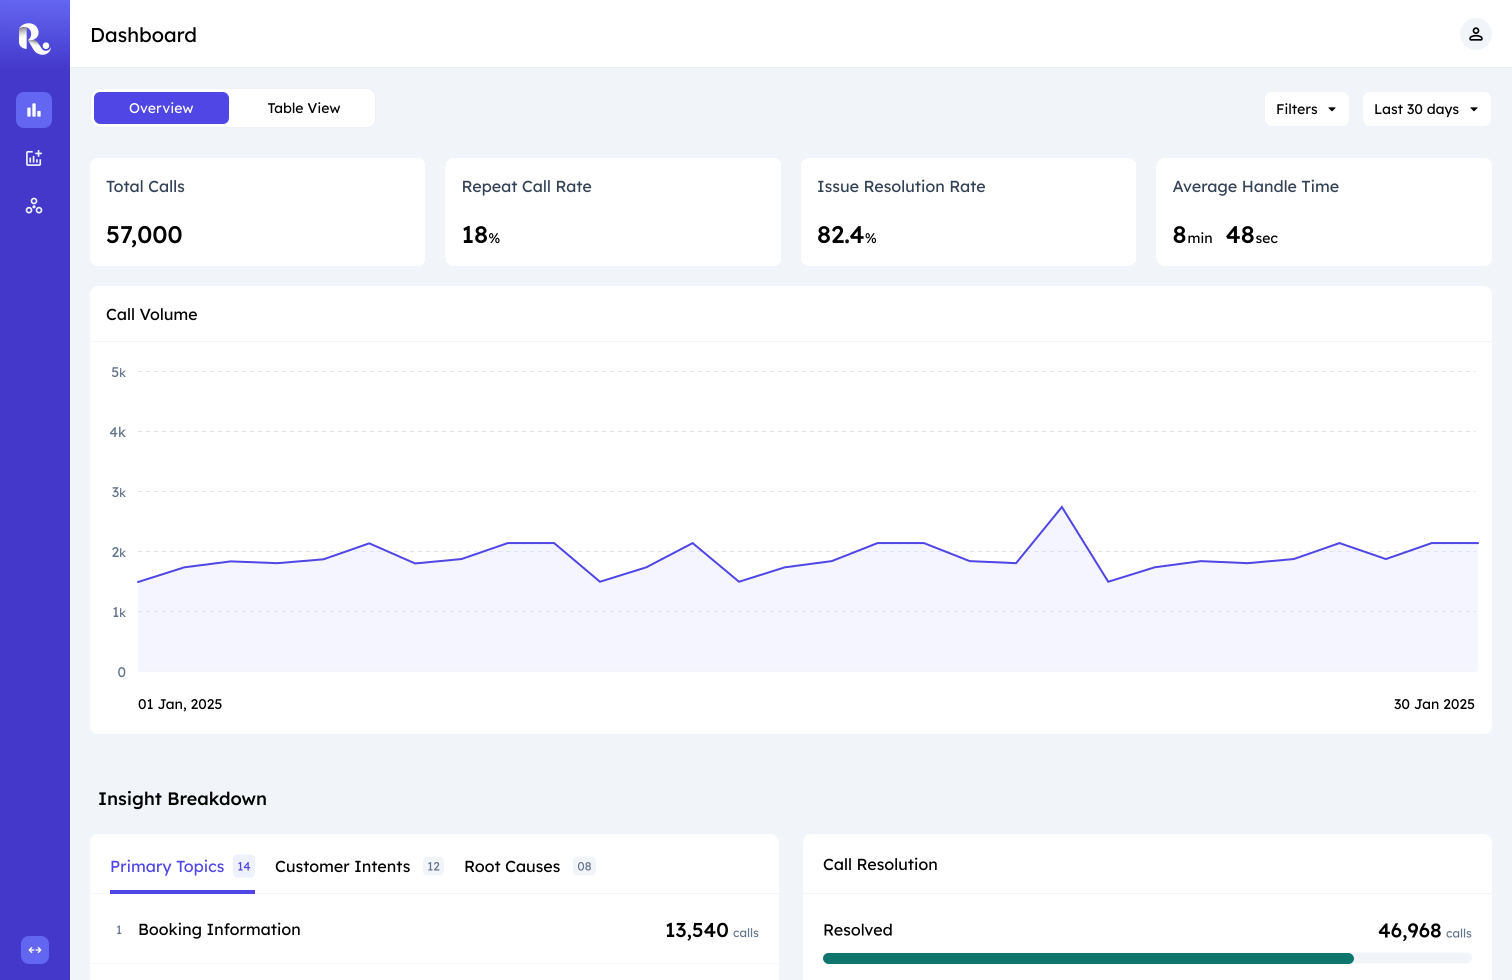
Overview
Teams needed a quick way to identify emerging customer issues without navigating call-level details.
I designed Overview as the signal detection layer, surfacing key metrics and conversation insights in a highly scannable format.
This helped teams identify where attention was needed before moving into deeper investigation.
Overview: Top View
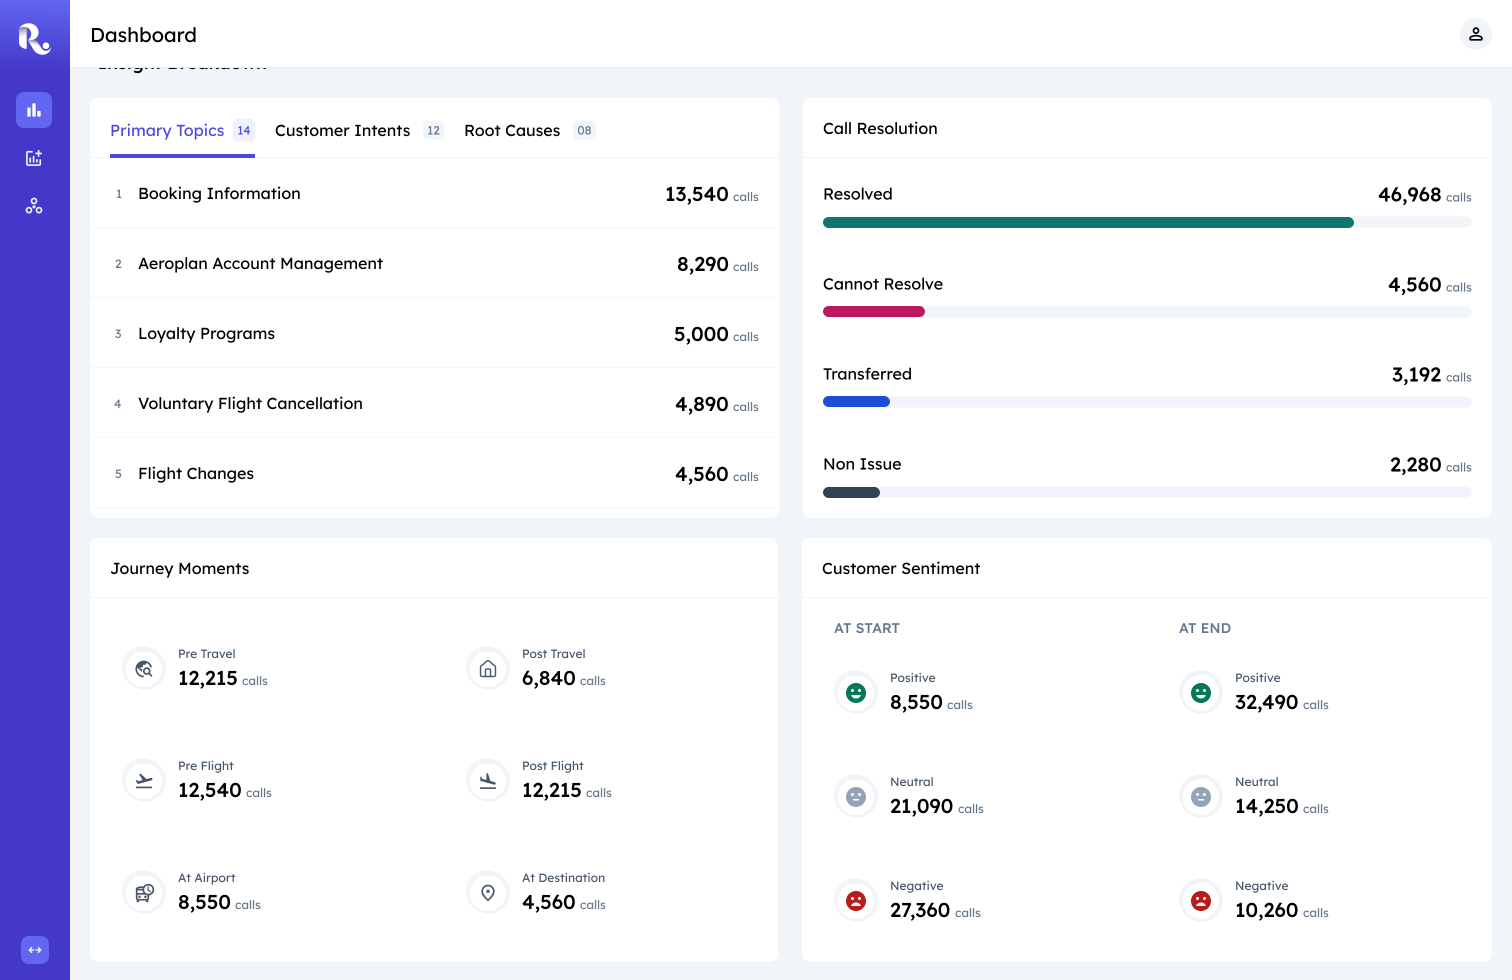
Insight Cards
Traditional charts like bar charts required users to compare trends, interpret legends, and hover for details before understanding what mattered.
I replaced the idea of embedding these visualizations with ranked insight cards that surfaced issues and call volumes directly.
This reduced interpretation effort and helped teams prioritize investigation faster.
Overview: Bottom View
Table View
High-level signals alone were not enough to explain why issues were occurring.
I designed Table View as the investigation workspace, exposing call-level summaries and 60+ operational attributes.
This gave teams the flexibility to trace patterns back to specific calls, queues, and routing paths.
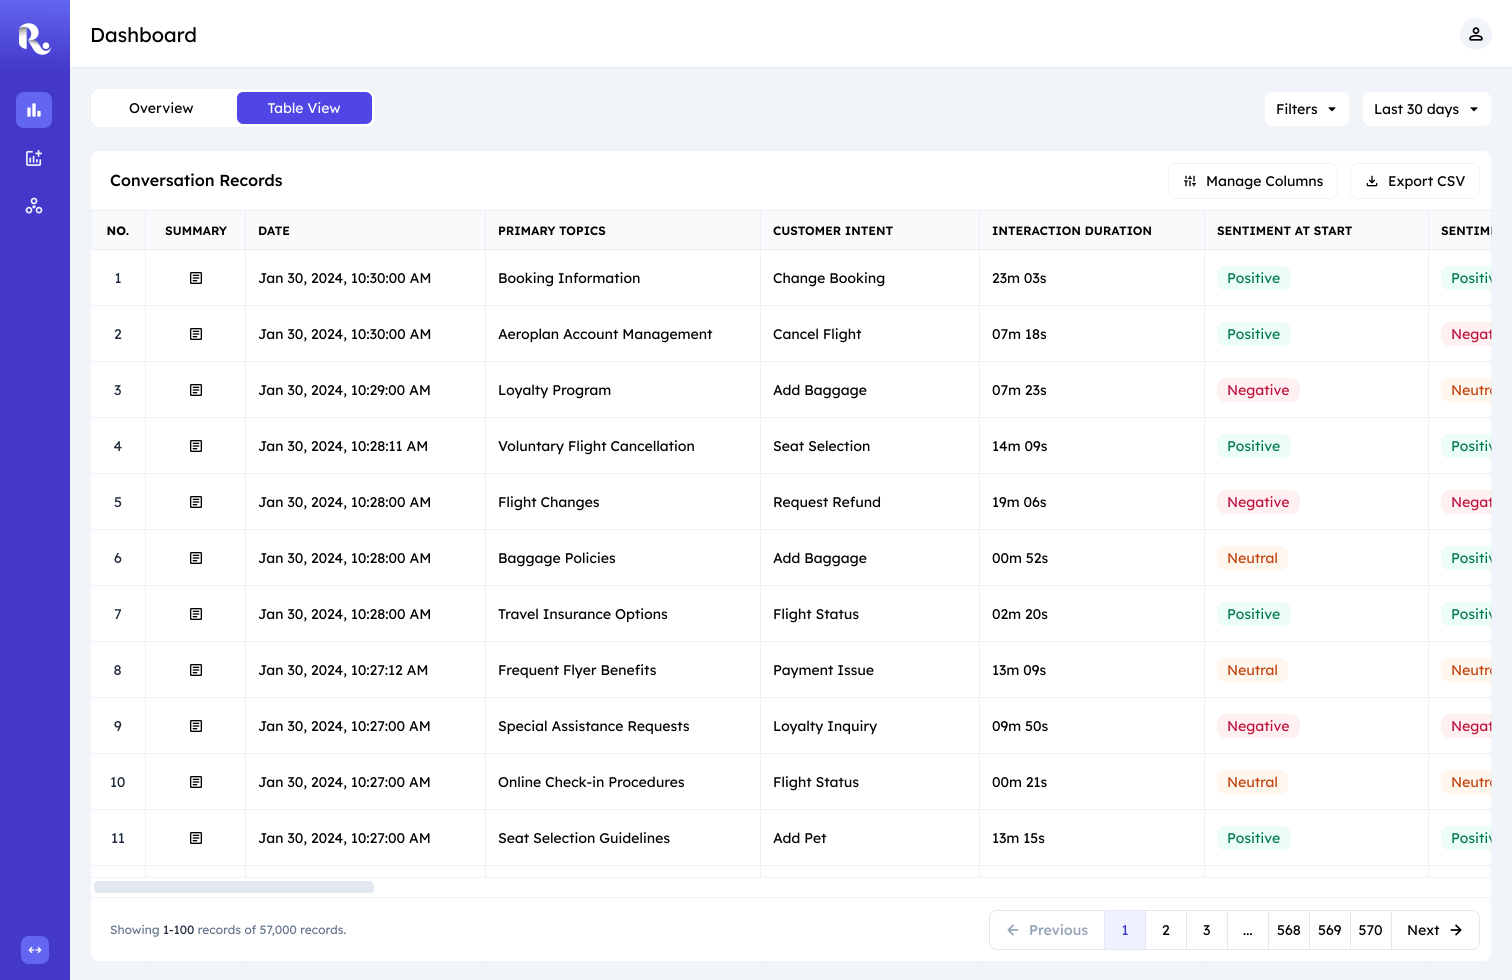
Table View
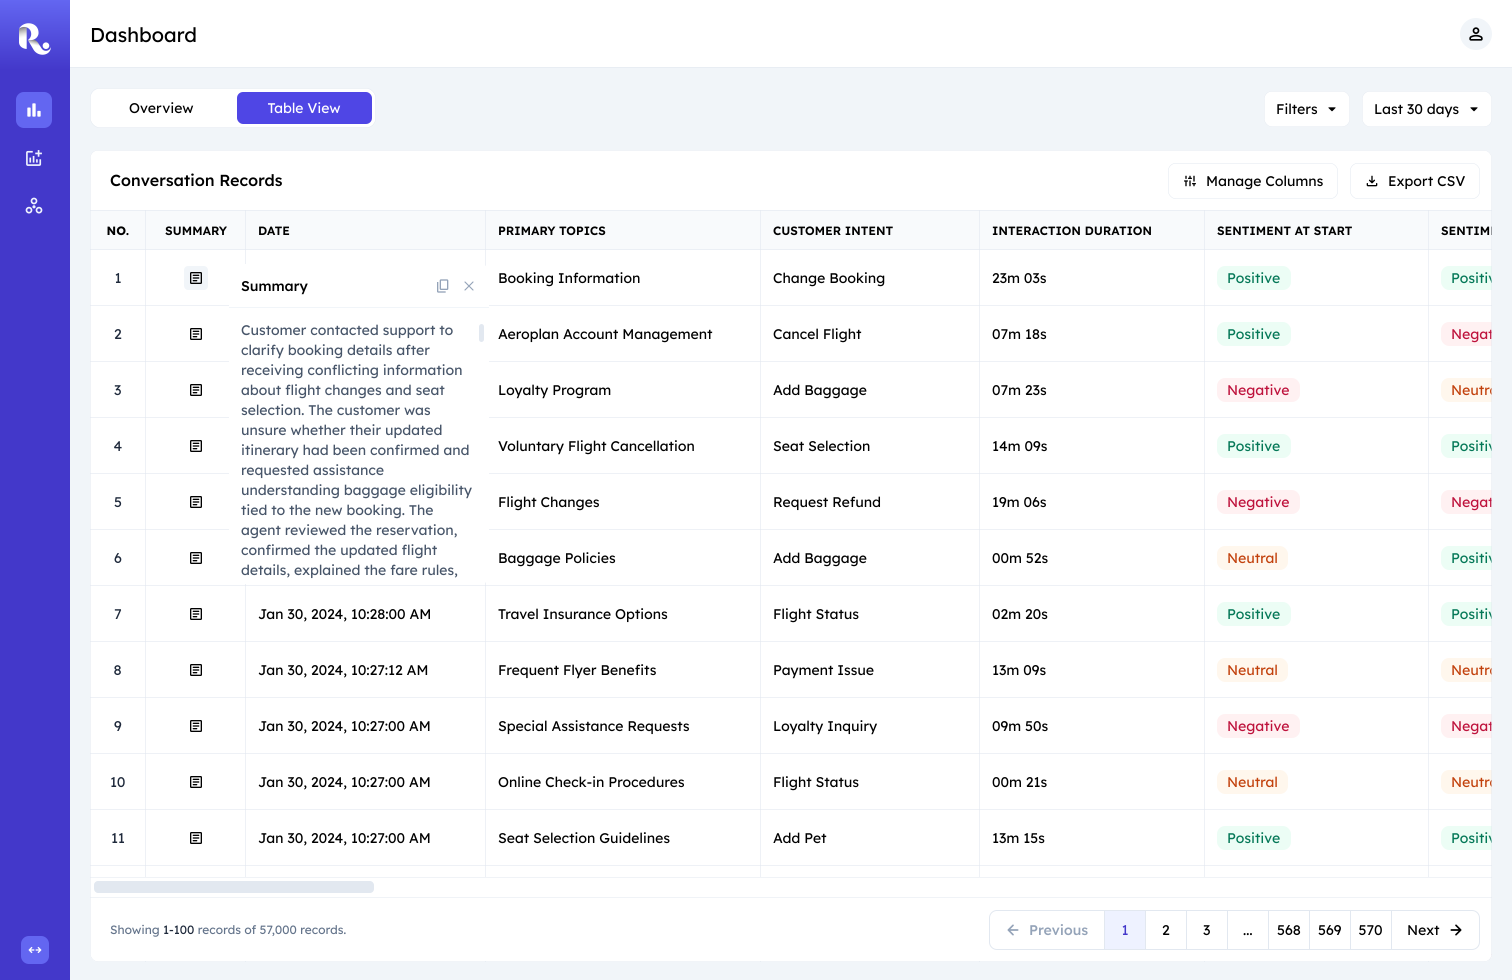
Summary Cards
Reading full call transcripts slowed investigation and added unnecessary effort.
I introduced AI-generated summary cards directly within the workflow to provide quick context behind each conversation.
Teams could understand what happened before deciding whether deeper review was necessary.
Call Summary Card
Filter Operations
Teams rarely investigated using a single condition. Most investigations relied on layered filters across topics, sentiment, and operational metadata.
I designed a query-based filtering system that supported complex filtering without cluttering the interface.
Filters and date ranges remained shared across both views, allowing teams to continue investigation without rebuilding context.
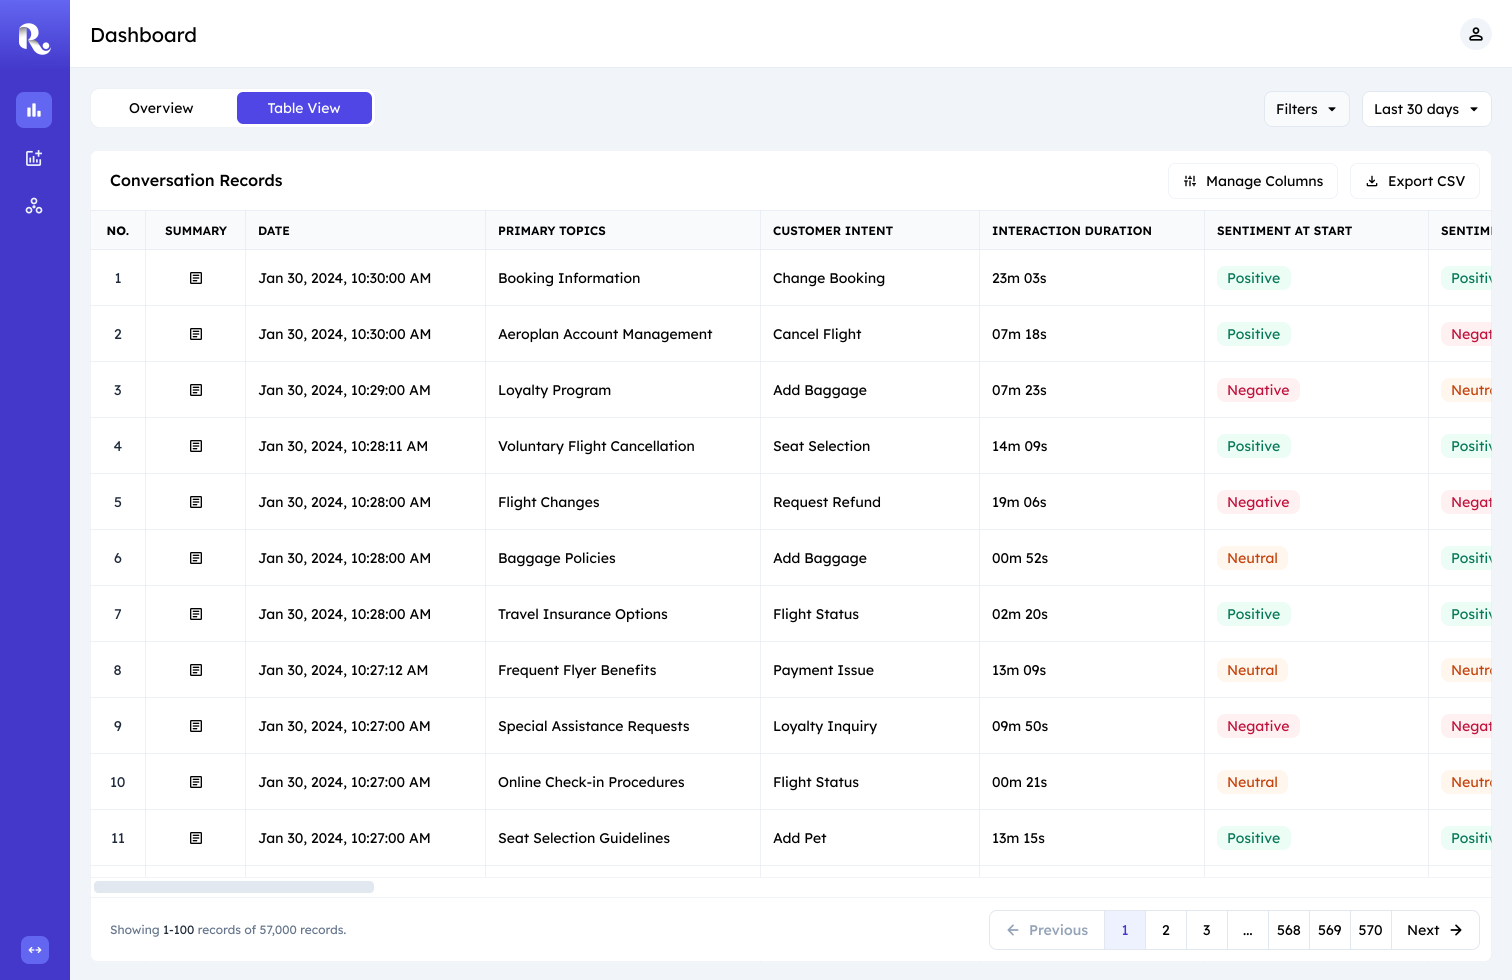
User views table view
Filter Prototype
Decisions:
Core thinking shaped by user feedback, intuition, and tradeoffs
In the following section, I share three specific examples that shaped design decisions illustration how I think.
Layout Structure & Hierarchy
After understanding the investigation workflow, the next challenge was structuring the interface around how users naturally moved between signal detection and deeper investigation.
While components such as filters and date ranges were foundational, the more important question was how these elements should be organized to match users' mental models and investigative behavior.
I explored several layout directions through wireframes, using them as discussion tools with my design lead to evaluate tradeoffs between separation, continuity, and cognitive load.
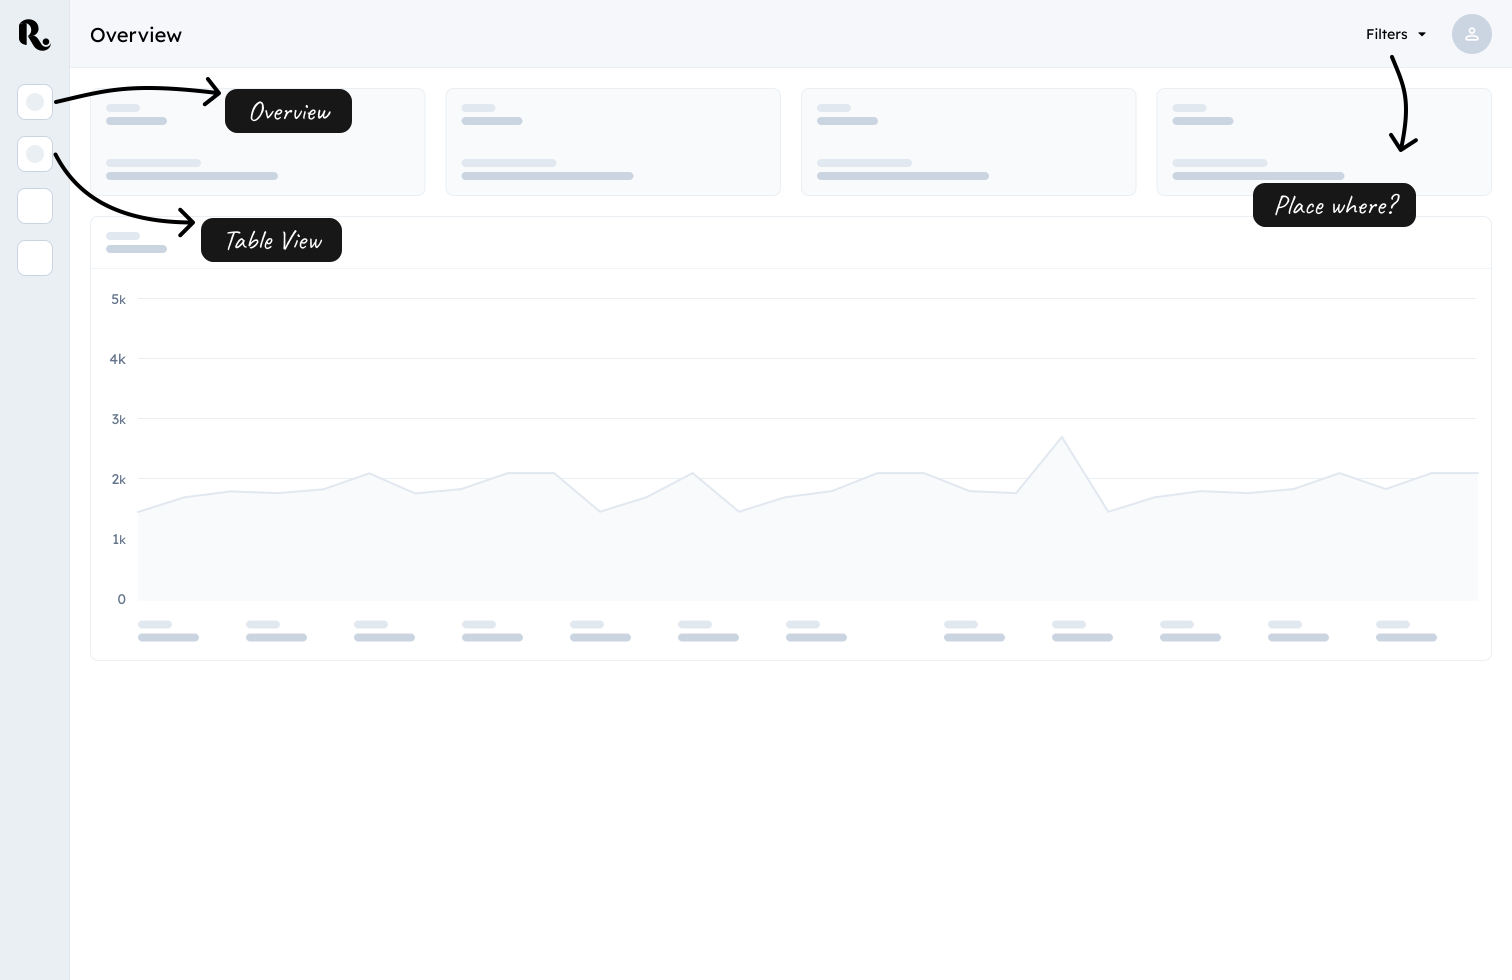
Version 1: Prioritizing separation through navigation
Layout Structure Iterations
Version 1: Prioritizing separation through navigation
I initially explored treating Overview and Table View as separate destinations to create strong separation between signal detection and investigation.
While this improved conceptual clarity, it introduced navigation overhead and weakened continuity between connected stages of analysis.
Version 2: Testing full contextual continuity
I explored combining both workflows within a single interface to preserve context and reduce switching.
While this improved continuity, the density of signals and operational details increased cognitive load and weakened rapid scanning.
Version 3: Balancing separation and continuity
The final direction introduced Overview and Table View as complementary modes within a shared dashboard experience.
This preserved distinct cognitive spaces for rapid signal detection and detailed investigation while maintaining continuity through shared filters and context.
Impact
The Real Deal
Adoption
Adopted by four contact center teams within the client organization and demonstrated to three external clients, all of whom expressed interest in rollout.
Efficiency gain
Replaced a fully manual reporting workflow, enabling contact center teams to access and investigate customer insights independently.
Qualitative validation
Broader adoption across teams and strong stakeholder feedback reinforced the platform’s role as a recurring operational tool.
Business outcome tie-in
The platform’s success led to new feature requests (under NDA) and supported a renewed client contract, reinforcing its long-term business value.
Thanks for Reading!
Thanks for following along! While I've walked you through the key strategic decisions, there's a lot more to the story.
I'd love to chat more about the detailed design iterations and the process of balancing business goals and engineering constraints. If you're interested in hearing more, I'm always up for a conversation!